You can follow below simple steps to configure FortiClient EMS and FortiAnalyzer to get the FortiClient logs in FortiAnalyzer. Before following the steps make sure to check Release Notes of EMS and FortiAnalyzer for supported firmware versions for the integration for respective product versions.
First, you have to enable the Administrative Domain (ADOM) option in FortiAnalyzer. Log on to FortiAnlyzer and go to “System Settings”

Now in the Dashboard turn on “Administrative Domain” feature.

Now go to the “All ADOMs” section and select FortiClient. Then click on “Enter ADOM”

Click on “Device Manager”

Now click on “+ Add Device” to add a device.

Type IP Address, Serial Number of the EMS Server, and a Device Name. When you enter the S/N, the device model will be automatically changed to FortiClient-EMS. Once done click on “Next” to continue and the device will be added to the FortiAnalyzer.

EMS status in FortiAnalyzer will be showing as “Log Status Down” and Logs status will be in a red circle. The reason for this because the FortiAnalyzer is not receiving any FortiClient Logs.

Once the device receives logs from FortiClient the Log Status will be changed to “Real Time”.

Configure FortiAnalyzer Settings on FortiClient Endpoint Management Server
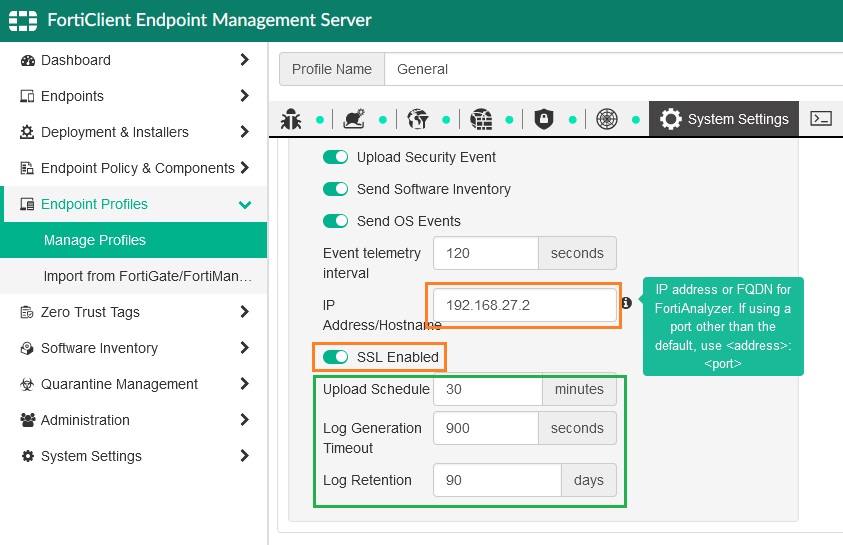
Log in to EMS and Go to Manage Profiles and set the FortiAnalyzer settings as below. Make sure to select the “SSL Enabled” option as FortiOS 6.4.X versions will not accept traffic if this option is disabled. You need to enable the setting on all the Manage Profiles.

Once the profile is synced to the client and according to your “Upload Schedule”, the logs will be forwarded to FortiAnalyzer and the FortiAnalyzer will start to get the logs. Also, note that FortiClient devices should have direct access to FortiAnalyzer on Port 514 to forward the logs.

To verify FortiClient Logs are receiving by the FortiAnlyzer you can use the below diagnose command.
diagnose sniffer packet any 'host <FortiClient IP Address> and tcp and port 514'


Leave a Reply